Multiple Choice Questions
Unit E2
Data Presentation
For each of these questions, choose the option (A, B, C or D) that is TRUE.
1
Which of the following would be MOST suitable for displaying the proportions of a city's budget spent on different items?
- (A)Pie chart
- (B)Bar chart
- (C)Line graph
- (D)Histogram
2
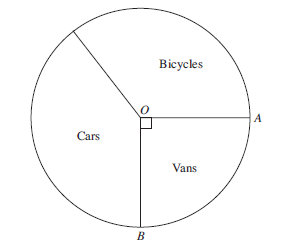
The pie chart above, not drawn to scale, shows the number of vehicles parked outside a supermarket. Angle AOB is a right angle. Given that there were 60 vehicles, how many vans were there?
- (A)4
- (B)6
- (C)15
- (D)20
3
60 students were asked to choose their favourite sport. These are the results:
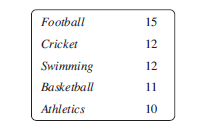
The data is to be illustrated in a pie chart.
What angle should be used for Football?
- (A)15°
- (B)60°
- (C)90°
- (D)180°
Pictogram for Questions 4 and 5.
In the pictogram,  represents 4 goals scored.
The number of goals scored by each player in 10 games is shown below.
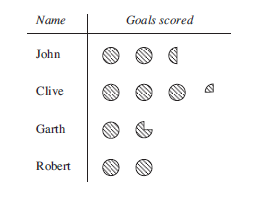
4
How many goals did Clive score in the 10 games?
- (A)3
- (B)12
- (C)13
- (D)14
5
How many goals were scored in total by the four players?
- (A)32
- (B)38
- (C)40
- (D)44
Total: -
of marks