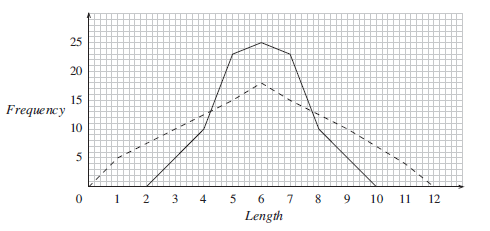
The two frequency polygons drawn on the graph below show samples which have the same mean, but the data in one are much more spread out than in the other.
The range (highest value – lowest value) gives a simple measure of how much the data are spread out.
Standard deviation (s.d.) is a much more useful measure and is given by the formula:
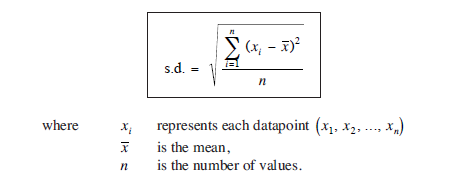
Then (xi − x)2 gives the square of the difference between each value and the mean (squaring exaggerates the effect of data points far from the mean and gets rid of negative values), and

sums up all these squared differences.
The expression
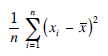
gives an average value to these differences. If all the data were the same, then each xi would equal x and the expression would be zero.
Finally we take the square root of the expression so that the dimensions of the standard deviation are the same as those of the data.
So standard deviation is a measure of the spread of the data. The greater its value, the more spread out the data are. This is illustrated by the two frequency polygons shown above. Although both sets of data have the same mean, the data represented by the 'dotted' frequency polygon will have a greater standard deviation than the other.
Worked Examples
Find the mean and standard deviation of the numbers,
6, 7, 8, 5, 9

The mean, x, is given by,
| x | = |
| = | |
| = 7 |
Now the standard deviation can be calculated.
| s.d. | = |
| = | |
| = | |
| = | |
| = 1.414 (to 3 decimal places) |
An alternative formula for standard deviation is
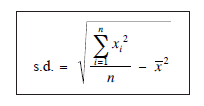
This expression is much more convenient for calculations done without a calculator. The proof of the equivalence of this formula is given below although it is beyond the scope of the GCSE syllabus.
Proof
You can see the proof of the equivalence of the two formulae by noting that


Find the mean and standard deviation of each of the following sets of numbers.
10, 11, 12, 13, 14
The mean, x, is given by
| x | = |
| = | |
| = 12 |
The standard deviation can now be calculated using the alternative formula.
| s.d. | = ⎛ ⎝⎞ ⎠ − 122 |
| = | |
| = | |
| = 1.414 (to 3 decimal places) |
5, 6, 12, 18, 19
The mean, x, is given by
| x | = |
| = 12 (as in part (a)) |
The standard deviation is given by
| s.d. | = ⎛ ⎝⎞ ⎠ − 122 |
| = | |
| = 5.831 (to 3 decimal places). |
Note that both sets of numbers have the same mean value, but that set (b) has a much larger standard deviation. This is expected, as the spread in set (b) is clearly far more than in set (a).
The table below gives the number of road traffic accidents per day in a small town.
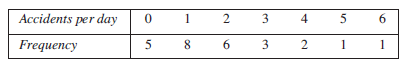
Find the mean and standard deviation of this data.
The necessary calculations for each datapoint, xi, are set out below.
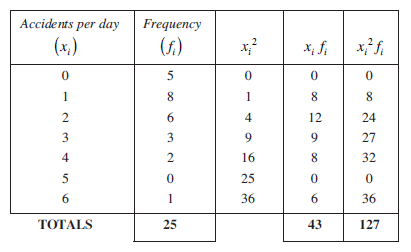
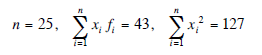
From the totals,
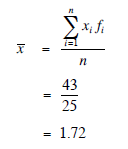
The mean, x, is now given by
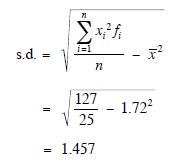
The standard deviation is now given by
Most scientific calculators have statistical functions which will calculate the mean and standard deviation of a set of data.
Exercises

On this page round your results to 2 decimal places if necessary.