Understanding Confidence Intervals
Target Group: Maths C mainly, but could be useful for Maths A and Maths B.
The concept of a confidence interval is quite difficult for beginning statistics students, and sometimes for beginning statistics teachers! For example, assume that our population parameter of interest is the population mean. What is the meaning of a 95% confidence interval in this situation?
Many students want to say that a 95% confidence interval means that there is a 95% chance that the confidence interval contains the population mean. But any particular confidence interval either contains the population mean, or it doesn’t. The confidence interval shouldn’t be interpreted as a probability.
The correct interpretation is based on repeated sampling. If samples of the same size are drawn repeatedly from a population, and a confidence interval is calculated from each sample, then 95% of these intervals should contain the population mean.
This can be demonstrated quite nicely using the TI-83.
Calculating a Confidence Interval
Either a z-statistic or a t-statistic can be used. I will use the t-statistic, as it is more commonly used with real data since the population standard deviation is usually not known.
Prepare an overhead from Appendix One. The students will draw their confidence intervals on this sheet.
Each student will now:
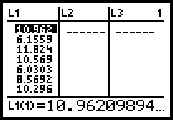
1. Generate a set of 20 numbers drawn from a random normal population, with a mean of 10 and a standard deviation of 3. Store this set in list L1.
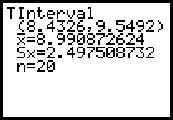
2. Use this data to generate a confidence interval, using a p-value of 0.67. With this value, about two-thirds of the confidence intervals generated will capture the mean. Note that in the example below, the confidence interval doesn’t capture the population mean.
3. Neatly draw their confidence interval on the overhead transparency, using an overhead pen.
4. Students should repeat this process until a sufficient number of confidence intervals are generated. I think 20 intervals should be enough.
Summary
What should happen is that about 13 or 14 of the confidence intervals capture the population mean. From this, the definition of a confidence interval can be developed naturally.
Appendix A
Confidence Intervals
|--- |
-|--- |
-|--- |
-|--- |
-|--- |
-|--- |
-|--- |
-|--- |
-|--- |
-|--- |
-|--- |
-|--- |
-|--- |
-|--- |
-|--- |
-|--- |
-|--- |
6 |
6.5 |
7 |
7.5 |
8 |
8.5 |
9 |
9.5 |
10 |
10.5 |
11 |
11.5 |
12 |
12.5 |
13 |
13.5 |
14 |
|--- |
-|--- |
-|--- |
-|--- |
-|--- |
-|--- |
-|--- |
-|--- |
-|--- |
-|--- |
-|--- |
-|--- |
-|--- |
-|--- |
-|--- |
-|--- |
-|--- |
6 |
6.5 |
7 |
7.5 |
8 |
8.5 |
9 |
9.5 |
10 |
10.5 |
11 |
11.5 |
12 |
12.5 |
13 |
13.5 |
14 |
|--- |
-|--- |
-|--- |
-|--- |
-|--- |
-|--- |
-|--- |
-|--- |
-|--- |
-|--- |
-|--- |
-|--- |
-|--- |
-|--- |
-|--- |
-|--- |
-|--- |
6 |
6.5 |
7 |
7.5 |
8 |
8.5 |
9 |
9.5 |
10 |
10.5 |
11 |
11.5 |
12 |
12.5 |
13 |
13.5 |
14 |
|--- |
-|--- |
-|--- |
-|--- |
-|--- |
-|--- |
-|--- |
-|--- |
-|--- |
-|--- |
-|--- |
-|--- |
-|--- |
-|--- |
-|--- |
-|--- |
-|--- |
6 |
6.5 |
7 |
7.5 |
8 |
8.5 |
9 |
9.5 |
10 |
10.5 |
11 |
11.5 |
12 |
12.5 |
13 |
13.5 |
14 |
|--- |
-|--- |
-|--- |
-|--- |
-|--- |
-|--- |
-|--- |
-|--- |
-|--- |
-|--- |
-|--- |
-|--- |
-|--- |
-|--- |
-|--- |
-|--- |
-|--- |
6 |
6.5 |
7 |
7.5 |
8 |
8.5 |
9 |
9.5 |
10 |
10.5 |
11 |
11.5 |
12 |
12.5 |
13 |
13.5 |
14 |
|--- |
-|--- |
-|--- |
-|--- |
-|--- |
-|--- |
-|--- |
-|--- |
-|--- |
-|--- |
-|--- |
-|--- |
-|--- |
-|--- |
-|--- |
-|--- |
-|--- |
6 |
6.5 |
7 |
7.5 |
8 |
8.5 |
9 |
9.5 |
10 |
10.5 |
11 |
11.5 |
12 |
12.5 |
13 |
13.5 |
14 |
|--- |
-|--- |
-|--- |
-|--- |
-|--- |
-|--- |
-|--- |
-|--- |
-|--- |
-|--- |
-|--- |
-|--- |
-|--- |
-|--- |
-|--- |
-|--- |
-|--- |
6 |
6.5 |
7 |
7.5 |
8 |
8.5 |
9 |
9.5 |
10 |
10.5 |
11 |
11.5 |
12 |
12.5 |
13 |
13.5 |
14 |
|--- |
-|--- |
-|--- |
-|--- |
-|--- |
-|--- |
-|--- |
-|--- |
-|--- |
-|--- |
-|--- |
-|--- |
-|--- |
-|--- |
-|--- |
-|--- |
-|--- |
6 |
6.5 |
7 |
7.5 |
8 |
8.5 |
9 |
9.5 |
10 |
10.5 |
11 |
11.5 |
12 |
12.5 |
13 |
13.5 |
14 |
|--- |
-|--- |
-|--- |
-|--- |
-|--- |
-|--- |
-|--- |
-|--- |
-|--- |
-|--- |
-|--- |
-|--- |
-|--- |
-|--- |
-|--- |
-|--- |
-|--- |
6 |
6.5 |
7 |
7.5 |
8 |
8.5 |
9 |
9.5 |
10 |
10.5 |
11 |
11.5 |
12 |
12.5 |
13 |
13.5 |
14 |
|--- |
-|--- |
-|--- |
-|--- |
-|--- |
-|--- |
-|--- |
-|--- |
-|--- |
-|--- |
-|--- |
-|--- |
-|--- |
-|--- |
-|--- |
-|--- |
-|--- |
6 |
6.5 |
7 |
7.5 |
8 |
8.5 |
9 |
9.5 |
10 |
10.5 |
11 |
11.5 |
12 |
12.5 |
13 |
13.5 |
14 |
|--- |
-|--- |
-|--- |
-|--- |
-|--- |
-|--- |
-|--- |
-|--- |
-|--- |
-|--- |
-|--- |
-|--- |
-|--- |
-|--- |
-|--- |
-|--- |
-|--- |
6 |
6.5 |
7 |
7.5 |
8 |
8.5 |
9 |
9.5 |
10 |
10.5 |
11 |
11.5 |
12 |
12.5 |
13 |
13.5 |
14 |
|--- |
-|--- |
-|--- |
-|--- |
-|--- |
-|--- |
-|--- |
-|--- |
-|--- |
-|--- |
-|--- |
-|--- |
-|--- |
-|--- |
-|--- |
-|--- |
-|--- |
6 |
6.5 |
7 |
7.5 |
8 |
8.5 |
9 |
9.5 |
10 |
10.5 |
11 |
11.5 |
12 |
12.5 |
13 |
13.5 |
14 |
|--- |
-|--- |
-|--- |
-|--- |
-|--- |
-|--- |
-|--- |
-|--- |
-|--- |
-|--- |
-|--- |
-|--- |
-|--- |
-|--- |
-|--- |
-|--- |
-|--- |
6 |
6.5 |
7 |
7.5 |
8 |
8.5 |
9 |
9.5 |
10 |
10.5 |
11 |
11.5 |
12 |
12.5 |
13 |
13.5 |
14 |