The objective of this section is to
- understand and use distance-time graphs.
Graphs that show distance against time can be used to describe journeys. The vertical scale shows the distance from the starting point or reference point.

The graph above illustrates 3 parts of a journey.
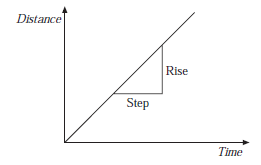
The gradient of a straight line gives the speed of the moving object.
Gradient is a measure of the speed.
Note that a negative gradient indicates that the object is moving towards the starting point rather than away from it.
The graph shows how far a child is from home.
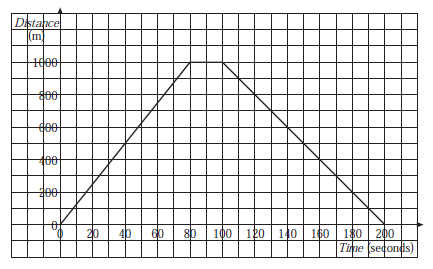
Describe how the child moves.
ShowThe first part of the graph shows the child moving away from home at a constant speed.
The second (horizontal) part of the graph shows that the child remains in the same position.
The third part of the graph shows the child returning to the starting point at a steady speed.
Calculate the speed of the child on each part of the journey.
ShowDuring the first stage the child travels 1000 m in 80 seconds.
| Speed | = |
| = | |
| = 12.5 m/s |
During the second stage the speed of the child is zero.
During the third stage as the child returns, he travels 1000 m in 100 seconds.
| Speed | = |
| = | |
| = 10 m/s |
On a journey, Rebecca drives at 50 mph for 2 hours, rests for 1 hour and then drives another 70 miles in
Draw a distance-time graph to illustrate this journey.
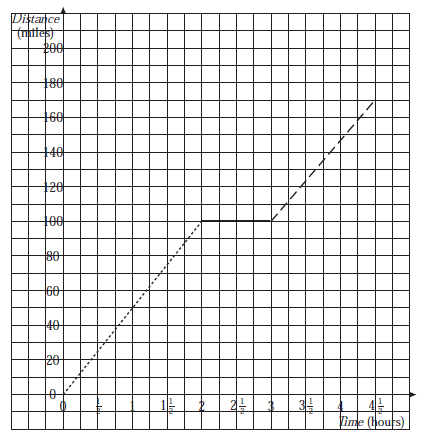
First stage 
Travels 100 miles in 2 hours.
Second stage 
Rests, so distance does not change.
Third stage 
Travels 70 miles in hours.
The graph shows how Tom's distance from home varies with time, when he visits Ian.
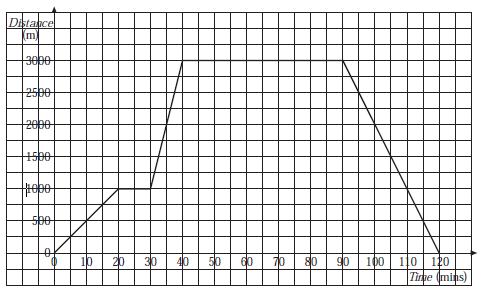
How long does Tom spend at Ian's?
ShowThe longer horizontal part of the graph represents the time that Tom is at Ian's.
| Time | = 90 − 40 |
| = 50 minutes |
How far is it from Tom's home to Ian's?
Show 3000 mFor how long does Tom stop on the way to Ian's?
Show Tom stops for 10 minutes, represented by the smaller horizontal part on the graph.On which part of the journey does Tom travel the fastest?
ShowHe travels fastest on the second part of the journey to Ian's. This is where the graph is steepest. He travels 2000 m in 10 minutes.
| Speed | = |
| = 200 m/minute | |
| = | |
| = 12 km/h |
How fast does Tom walk on the way back from Ian's?
ShowTom travels 3000 m in 30 mins.
| Speed | = |
| = | |
| = 100 m/minute |