Text
Unit E3 Section 2
Finding the Mean from Tables and Tally Charts

Often data are collected into tables or tally charts. This section considers how to find the mean in such cases.

Worked Examples

1

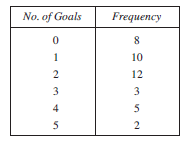
A football team keep records of the number of goals it scores per match during a season. The list is shown opposite.

Find the mean number of goals per match.

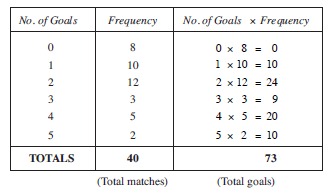
The previous table can be used, with a third column added.

The mean can now be calculated.

Mean =
= 1.825
2

The bar chart shows how many cars were sold by a salesman over a period of time.

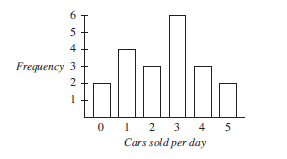
Find the mean number of cars sold per day.

The data can be transferred to a table and a third column included as shown.
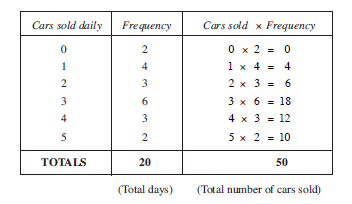
Mean =
= 2.5 cars
3

A police station kept records of the number of road traffic accidents in their area each day for 100 days. The figures below give the number of accidents per day.

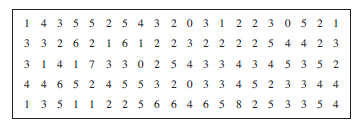
Find the mean number of accidents per day.

The first step is to draw out and complete a tally chart. The final column shown below can then be added and completed.

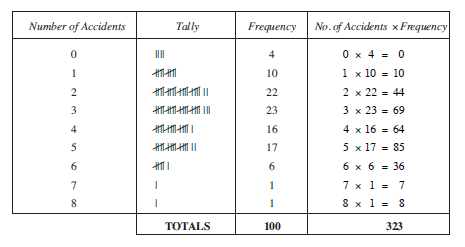
Mean number of accidents per day = = 3.23

4

The marks obtained by 25 pupils on a test are shown below.

(a)

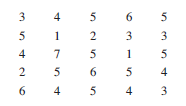
Copy and complete the frequency table below to present the information given above.

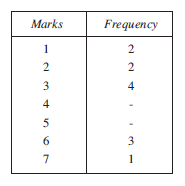
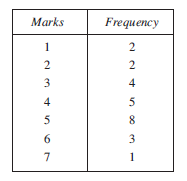
(Check: total frequency = 2 + 2 + 4 + 5 + 8 + 3 + 1 = 25)

(b)

Using the frequency distribution, state

(i)

the modal mark

Modal mark = 5 (with frequency 8)

(ii)

the median mark

Median mark = 4 (as we need the 13th number, when in order)

(iii)

the range.

Range = 7 − 1 = 6

(c)

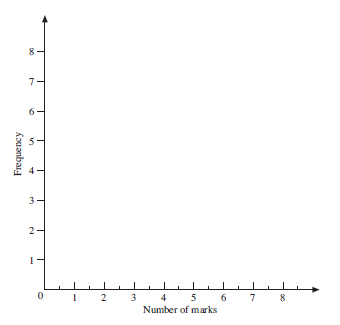
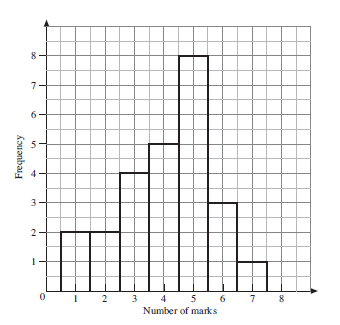
On graph paper, draw a histogram to illustrate the frequency distribution. Use axes as labelled below.

(d)

A pupil is chosen at random from the group of pupils. What is the probability that the pupil's mark is greater than 5 ?

p(mark greater than 5) = = = 0.16

Information

The study of statistics was begun by an English mathematician, John Graunt (1620–1674). He collected and studied the death records in various cities in Britain and, despite the fact that people die randomly, he was fascinated by the patterns he found.

Exercises

A survey of 100 households in an American town asked how many cars there were in each household The results are given below.

No. of carsFrequency
05
170
221
33
41

Calculate the mean number of cars per household.

cars

The survey in question 1 also asked how many TV sets there were in each household. The results are given below.

No. of TV SetsFrequency
02
130
252
38
45
53

Calculate the mean number of TV sets per household.

TV sets

A manager keeps a record of the number of calls she makes each day on her mobile phone.

Number of calls
per day
012345678
Frequency347812101431

Calculate the mean number of calls per day.

calls

A class conduct an experiment in biology. They place a number of 1 m by 1 m square grids on the playing field and count the number of plants in each grid. The results obtained are given below.

6321321301
0321140120
1122243111
2331222171
(a)

Calculate the mean number of plants.

plants
(b)

How many times was the number of plants seen greater than the mean?

times

In a season a football team scored a total of 55 goals. The table below gives a summary of the number of goals per match.

Goals per MatchFrequency
04
16
2
38
42
51
(a)

In how many matches did they score 2 goals?

matches
(b)

Calculate the mean number of goals per match.

goals

A traffic warden is trying to work out the mean number of parking tickets he has issued per day. He produced the table below, but has accidentally rubbed out some of the numbers.

Fill in the missing numbers and calculate the mean.

Tickets per dayFrequencyNo. of Tickets × Frequency
01
11
210
37
420
52
6
TOTALS2672

mean = (to 1 d.p.)

The bar chart below shows the shoe sizes of a group of 50 children.

(a)

How many children wear a size 7 shoe?

children
(b)

How many children wear a shoe size smaller than size 7?

children
(c)

Which shoe size is the modal size?

(d)

What is the median shoe size?

(e)

What is the probability that a child selected at random wears:

(i)

a shoe size of 5?

p =
(ii)

a shoe size larger than 6?

p =
(f)

Which of these two averages, the mode and the median, would be of greater interest to the owner of a shoe shop who wishes to stock up on children's shoes?