If more than one inequality has to be satisfied, then the required region will have more than one boundary. The diagram below shows the inequalities x ≥ 1, y ≥ 1 and x + y ≤ 6 .
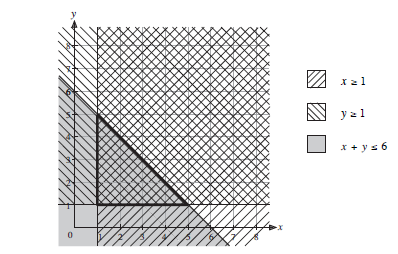
The triangle indicated by bold lines has all three shadings. The points inside this region, including those points on each of the boundaries, satisfy all three inequalities.
Worked Examples
Find the region which satisfies the inequalities
x ≤ 4, y ≤ 2x, y ≥ x + 1
Write down the coordinates of the vertices of this region.

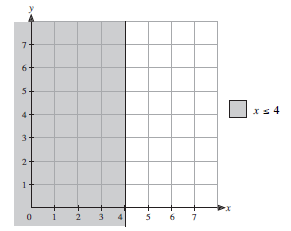
First shade the region which is satisfied by the inequality
x ≤ 4
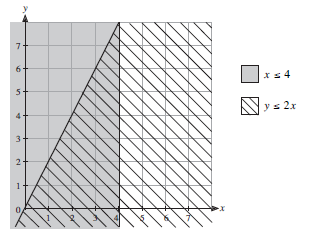
Then add the region which satisfies
y ≤ 2x
using a different type of shading, as shown.
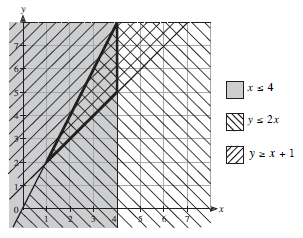
Finally, add the region which is satisfied by
y ≥ x + 1
using a third type of shading.
The region which has been shaded in all three different ways (the triangle outlined in bold) satisfies all three inequalities.
The coordinates of its vertices can be seen from the diagram as (1, 2), (4, 5) and (4, 8).
Note
When a large number of inequalities are involved, and therefore a greater amount of shading, the required region becomes more difficult to see on the graph.
Therefore it is better to shade out rather shade in, leaving the required region unshaded. This method is used in the following example, where 'shadow' shading indicates the side of the line which does not satisfy the relevant inequality. The region where all the inequalities are true is called the feasible region. All points inside the feasible region satisfy all the inequalities.
A small factory employs people at two rates of pay. The maximum number of people who can be employed is 10. More workers are employed on the lower rate than on the higher rate.
Describe this situation using inequalities, and draw a graph to show the feasible region in which they are satisfied.
Let x = number employed at the lower rate of pay,
and y = number employed at the higher rate of pay.
The maximum number of people who can be employed is 10, so x + y ≤ 10.
As more people are employed at the lower rate than the higher rate, then x > y.
As neither x nor y can be negative, then x ≥ 0 and y ≥ 0 .
These inequalities are represented on the graph below.
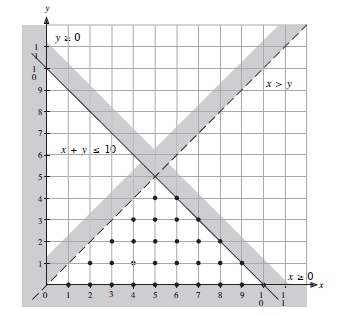
The triangle formed by the unshaded sides of each line is the region where all four inequalities are satisfied. The dots indicate all the possible employment options. Note that only integer values inside the region are possible solutions.
Note
Often there is a linear objective (e.g. profit or something similar) for which we need to find its optimal value (e.g. maximum or minimum), subject to a number of inequalities. This is called linear programming and it is an important topic.
We can solve linear programming problems easily by finding the value of the objective function at each vertex of the feasible region. The maximum and minimum values must occur at a vertex of the feasible region. We will illustrate this method in Worked Example 3, below.
The shaded area in the diagram below shows the solution of a set of inequalities in x and y. The variable x represents the number of boys in a cricket club and y represents the number of girls in the cricket club.

Use the graph above to answer the questions which follow.
State, using arguments based on the graph, whether the cricket club can have as members:
10 boys and 5 girls
No, as point (10, 5) is not in the feasible region.
6 boys and 6 girls.
Yes, as point (6, 6) is in the feasible region.
Write down the set of THREE inequalities that define the shaded region.
y ≤ − + 12 ; y ≥ 2 ; y ≤ 2x
A company sells shirts for the club and makes a profit of £3.00 on a boy's shirt and £5.00 on a girl's shirt.
Write an expression in x and y that represents the total profit made by the company on the sale of shirts.
P = 3x + 5y
Calculate the minimum profit the company can make.
The vertices are at (1, 2), ( 4, 8), (12, 2) and the corresponding values of P are £13 , £55 , £47 .
So the minimum profit is at (1, 2) of value £13.
Exercises
