Text
Unit G1 Section 4
Plotting Curves

Some relationships produce curves rather than straight lines when plotted.

Worked Examples

1
(a)

Complete the table below using the relationship y = x2 − 2.

x–3–2–10123
y

For each value of x the y value can be calculated using y = x2 − 2.

For example:

If x = 3 then y = 32 − 2
= 9 − 2
= 7
If x = 1 then y = 12 − 2
= 1 − 2
= −1
If x = –2 then y = (−2)2 − 2
= 4 − 2
= 2

Calculating all the values gives the table.

x–3–2–10123
y72–1–2–127
(b)

Write a list of coordinates using the data in the table.

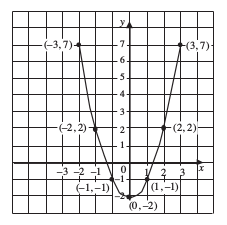
The coordinates of the points to plot are (–3, 7), (–2, 2), (–1, –1), (0, –2), (1, –1), (2, 2) and (3, 7).

(c)

Plot the points and draw a smooth curve through them.

These points are plotted on the following graph and have been joined by a smooth curve.

2

Draw the graph of y = x3 − 4x for values of x from –3 to 3.

The first step is to draw up and complete a table of values using the relationship

y = x3 − 4x, as below.

x–3–2–10123
y–15030–3015

For example:

If x = –3 then y = (−3)3 − 4 × (−3)
= −27 + 12
= −15
If x = 2 then y = 23 − 4 × 2
= 8 − 8
= 0

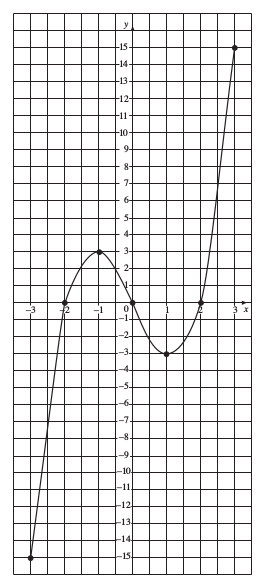
Each pair of values can be written as coordinates,

(–3, –15), (–2, 0), (–1, 3), (0, 0), (1, –3), (2, 0), (3, 15)

These can then be plotted and a smooth curve drawn through the points as shown in the following graph.

Exercises

Complete the table below for y = x2 − 5.

x–3–2–10123
y–44

Plot these points and draw a smooth curve through the points.

(a)

Complete the table and draw the graph of y = x2x − 2.

x–2–10123
y0–2
(b)

What is the value of x at the lowest point of the curve?

x =
(c)

Use your answer to (b) to calculate the corresponding value of y.

y =
(a)

Complete the table using the relationship y = x3 − x.

x–2–1012
y06

Using the information in the table, sketch the graph of y = x3 − x.

(b)

Complete the following pairs of coordinates.

(–0.5, ), (0.5, )

A manufacturer of postcards decides to experiment with cards of different shapes. The cards should be rectangles with an area of 120 cm2. The height of the cards is y cm and the width is x cm.

(a)

Complete the table.

x51015202530
y124

Draw a graph of y = .

(b)

Use your graph to find the width of a postcard that has a height of 7 cm.

Width: about cm
(c)

If the height of a postcard must be no greater than 14 cm, what is the least width it can have?

About cm (to 1 d.p.)

Some water tanks have square bases and a height of 2 m.

(a)

What is the volume of the tank?

V =
(b)

Complete the table.

y = x − 2

x00.51.01.52.02.5
y12.5

Draw the graph of the volume.

(c)

If the base of a tank is a square sheet of metal 2.2 m by 2.2 m, find from the graph the volume of the tank.

About m3 (to 1 d.p.)
(d)

What should be the size of the base (to 1 d.p.) in order to give a volume of

(i)
10 m3 m
(ii)
5 m3 m

The height, h, in metres, of a ball hit straight up into the air is given by the formula

h = 18t − 5t2

where t is the time in seconds.

(a)

Complete this table and draw a graph of h against t.

t01234
h16
(b)

Use your graph to estimate when the ball hits the ground.

About seconds (to 1 d.p.)
(c)

What is the maximum height reached by the ball?

Just over metres.

Angela is investigating the area of squares.

She makes a table.

Length of side (cm)012345
Area (cm2)01491625

Draw a graph of area against length of side on a copy of the following grid.

(a)

The side of a square is x cm. The area of a square is A cm2. Write down the formula which may be used to calculate the area from the length of the side.

=

A square has an area of 12 cm2 . Angela wants to use the graph to find the length of the side of this square.

She draws a line on the graph to help her do this. Draw this line.

(b)

Write down the length of the side of the square whose area is 12 cm2.

About cm (to 2 d.p.)