Linear Functions
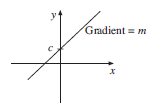
Linear functions are always straight lines and have equations which can be put in the form
y = mx + c
Quadratic Functions
Quadratic functions contain an x2 term as well as multiples of x and a constant. Some examples are:
y = 2x2 y = x2 − x + 5 y = 6 − x2
The following graphs show 3 examples.
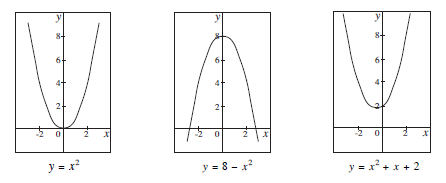
Note that each curve has either a maximum or a minimum point which lies on its axis of symmetry. The curve has a maximum point when the coefficient of x2 is negative as in the second example, or minimum if the coefficient of x2 is positive. Also the curve can intersect the x-axis twice, just touch it once or never meet the x-axis.
Cubic Functions
Cubic functions involve an x3 term and possibly x2 , x and constant terms as well. Some examples are:
y = x3, y = x3 + 3x2 + 4x − 8, y = x3 − 5, y = x3 − x + 1
The graphs below show some examples.

The graph of a cubic function can intersect the x-axis once as in examples (a), (b) and (e), touch the axis once and intersect it once as in example (c) or intersect the x-axis three times as in examples (d) and (f).
In examples (c), (d) and (f) the curve has a local minimum and a local maximum.
Note how the shape of the curve changes when a −x3 is introduced. Compare examples (a) and (e).
Reciprocal Functions
Reciprocal functions have the form of a fraction with x as the denominator. Examples of reciprocal functions are:
y = , y = , y = , y =
The graphs below show some examples.

The curves are split into two distinct parts. The curves get closer and closer to the axes as is clear in the diagrams. The curves have two lines of symmetry, y = x and y = −x .
Worked Examples
Exercises
