
A tangent is a line that touches a curve at one point only, as shown opposite.
The gradient of the tangent gives the gradient of the curve at that point. The gradient of the curve gives the rate at which a quantity is changing. For example, the gradient of a distance-time curve gives the rate of change of distance with respect to time, which gives the velocity.
Worked Examples
Draw the graph of y = x3 for −2 ≤ x ≤ 2. Draw tangents to the curve at x = –1 and x = 1. Find the gradients of these tangents.

The graph of y = x3 is shown below. The tangents have been drawn at x = –1 and x = 1.
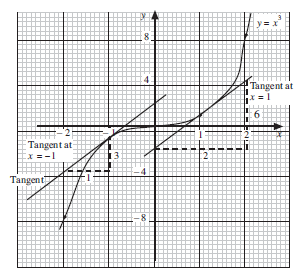
The triangles drawn under each tangent show that the gradients of both tangents are 3.
The height, h, of a ball thrown straight up in the air varies so that at time, t, h = 8t − 5t2 .
Plot a graph of h against t and use it to find:
(a) the speed of the ball when t = 0.6,
(b) the greatest speed of the ball.
The table below gives the values needed to plot the graph.
| t(s) | 0 | 0.2 | 0.4 | 0.6 | 0.8 | 1.0 | 1.2 | 1.4 | 1.6 |
| h(m) | 0 | 1.4 | 2.4 | 3.0 | 3.2 | 3.0 | 2.4 | 1.4 | 0 |
The graph is shown below.

(a) A tangent has been drawn at the point where
(b) The speed of the ball is a maximum when the curve is steepest, that is at t = 0 and t = 1.6. At t = 1.6 the gradient is = −8. So the speed is 8 m/s.
The '–' sign indicates that the ball is moving down rather than up. You can say the ball moves down with speed 8 m/s or that the velocity of the ball is –8 m/s.
The following graph represents the cooling curve for a certain liquid.
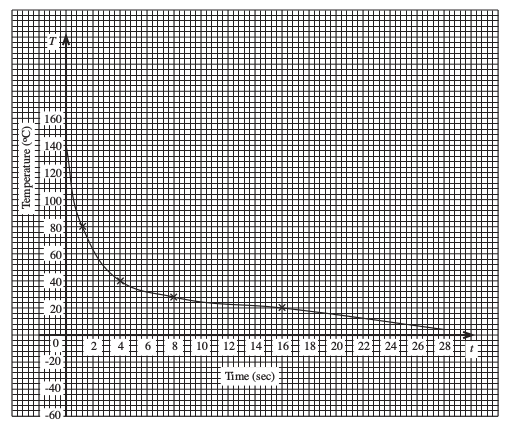
Use the graph to estimate
the temperature when the time, t, is 12 secs.
From the graph, temperature ≈ 24°C at time 12 secs.
the gradient of the curve when the time, t, is 4 secs.
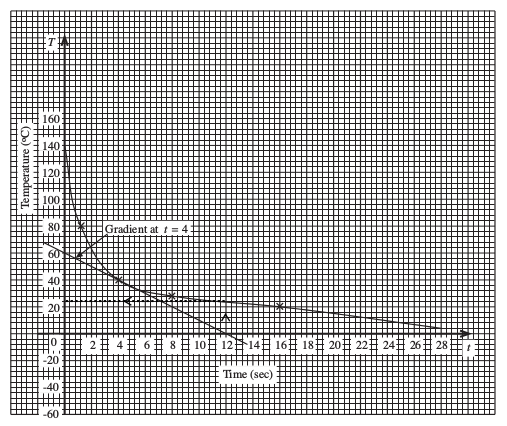
From the graph, gradient ≈ = 5 °C per sec.
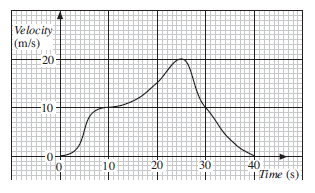
The graph shows how the velocity of a car changes.
Find:
(a) the time when the acceleration of the car is zero,
(b) the acceleration when t = 30.
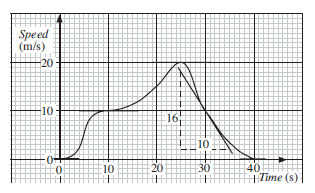
The acceleration of the car is given by the gradient of the velocity-time graph. There are 4 points where the gradient is zero, at t = 0, t = 10, t = 25 and t = 40. At each of these points a horizontal tangent can be drawn to the curve as shown opposite.
A tangent has been drawn to the curve at t = 30.
The gradient of this curve is = −1.6, so the acceleration is −1.6 m/s2.
Exercises
